Saving a London first home deposit takes nearly twice as long as it did in 2000
At 10% of median full-time net income, a London first home deposit that took about eight years to save in 2000 now takes around fourteen. Two numbers govern the movement: London house prices (opens in new tab) and median earnings (opens in new tab). The years between 2000 and 2025 show how that relationship reshaped the timeline.
London first home deposit now takes 14 years to save
London has stayed far above the rest of England throughout, and the gap has not closed.
Why the London timeline kept expanding
When the deposit costs less than a year’s net income, a 10% savings rate closes the gap inside a reasonable horizon. When it costs more, the maths changes shape.
London 10% deposit now costs around 1.4 years of net pay
London has held above the threshold for over two decades. England’s brief crossing between 2021 and 2023 came and went. The ratio is the slowest-moving variable in the system, and at 10% saved the timeline equals the ratio multiplied by ten.
A 10% deposit is the floor. The 20% deposit most buyers put down (opens in new tab) doubles the timeline, to around thirty years.
The years that did the work
A timeline that moves in net terms is built from years that either gained ground against the target or lost it.
London first home deposit lost most ground in 2014–16
In the 2014 to 2016 window, the deposit target outpaced what saving could add to position. The recovery that followed has retraced part of the run-up but not closed it. Across the UK, the average first-time buyer is now 33, two years older than a decade ago.
This is a data analysis and visualisation, not financial or mortgage advice. The calculation models a single median full-time earner saving 10% of net annual income toward a deposit of 10% of the purchase price, with gross earnings converted to net using HMRC tax and National Insurance rates for each year, and does not account for joint purchasing, family contributions, regional variation within London, or individual circumstance. The author accepts no responsibility for financial decisions made on the basis of this analysis.
Selected Work
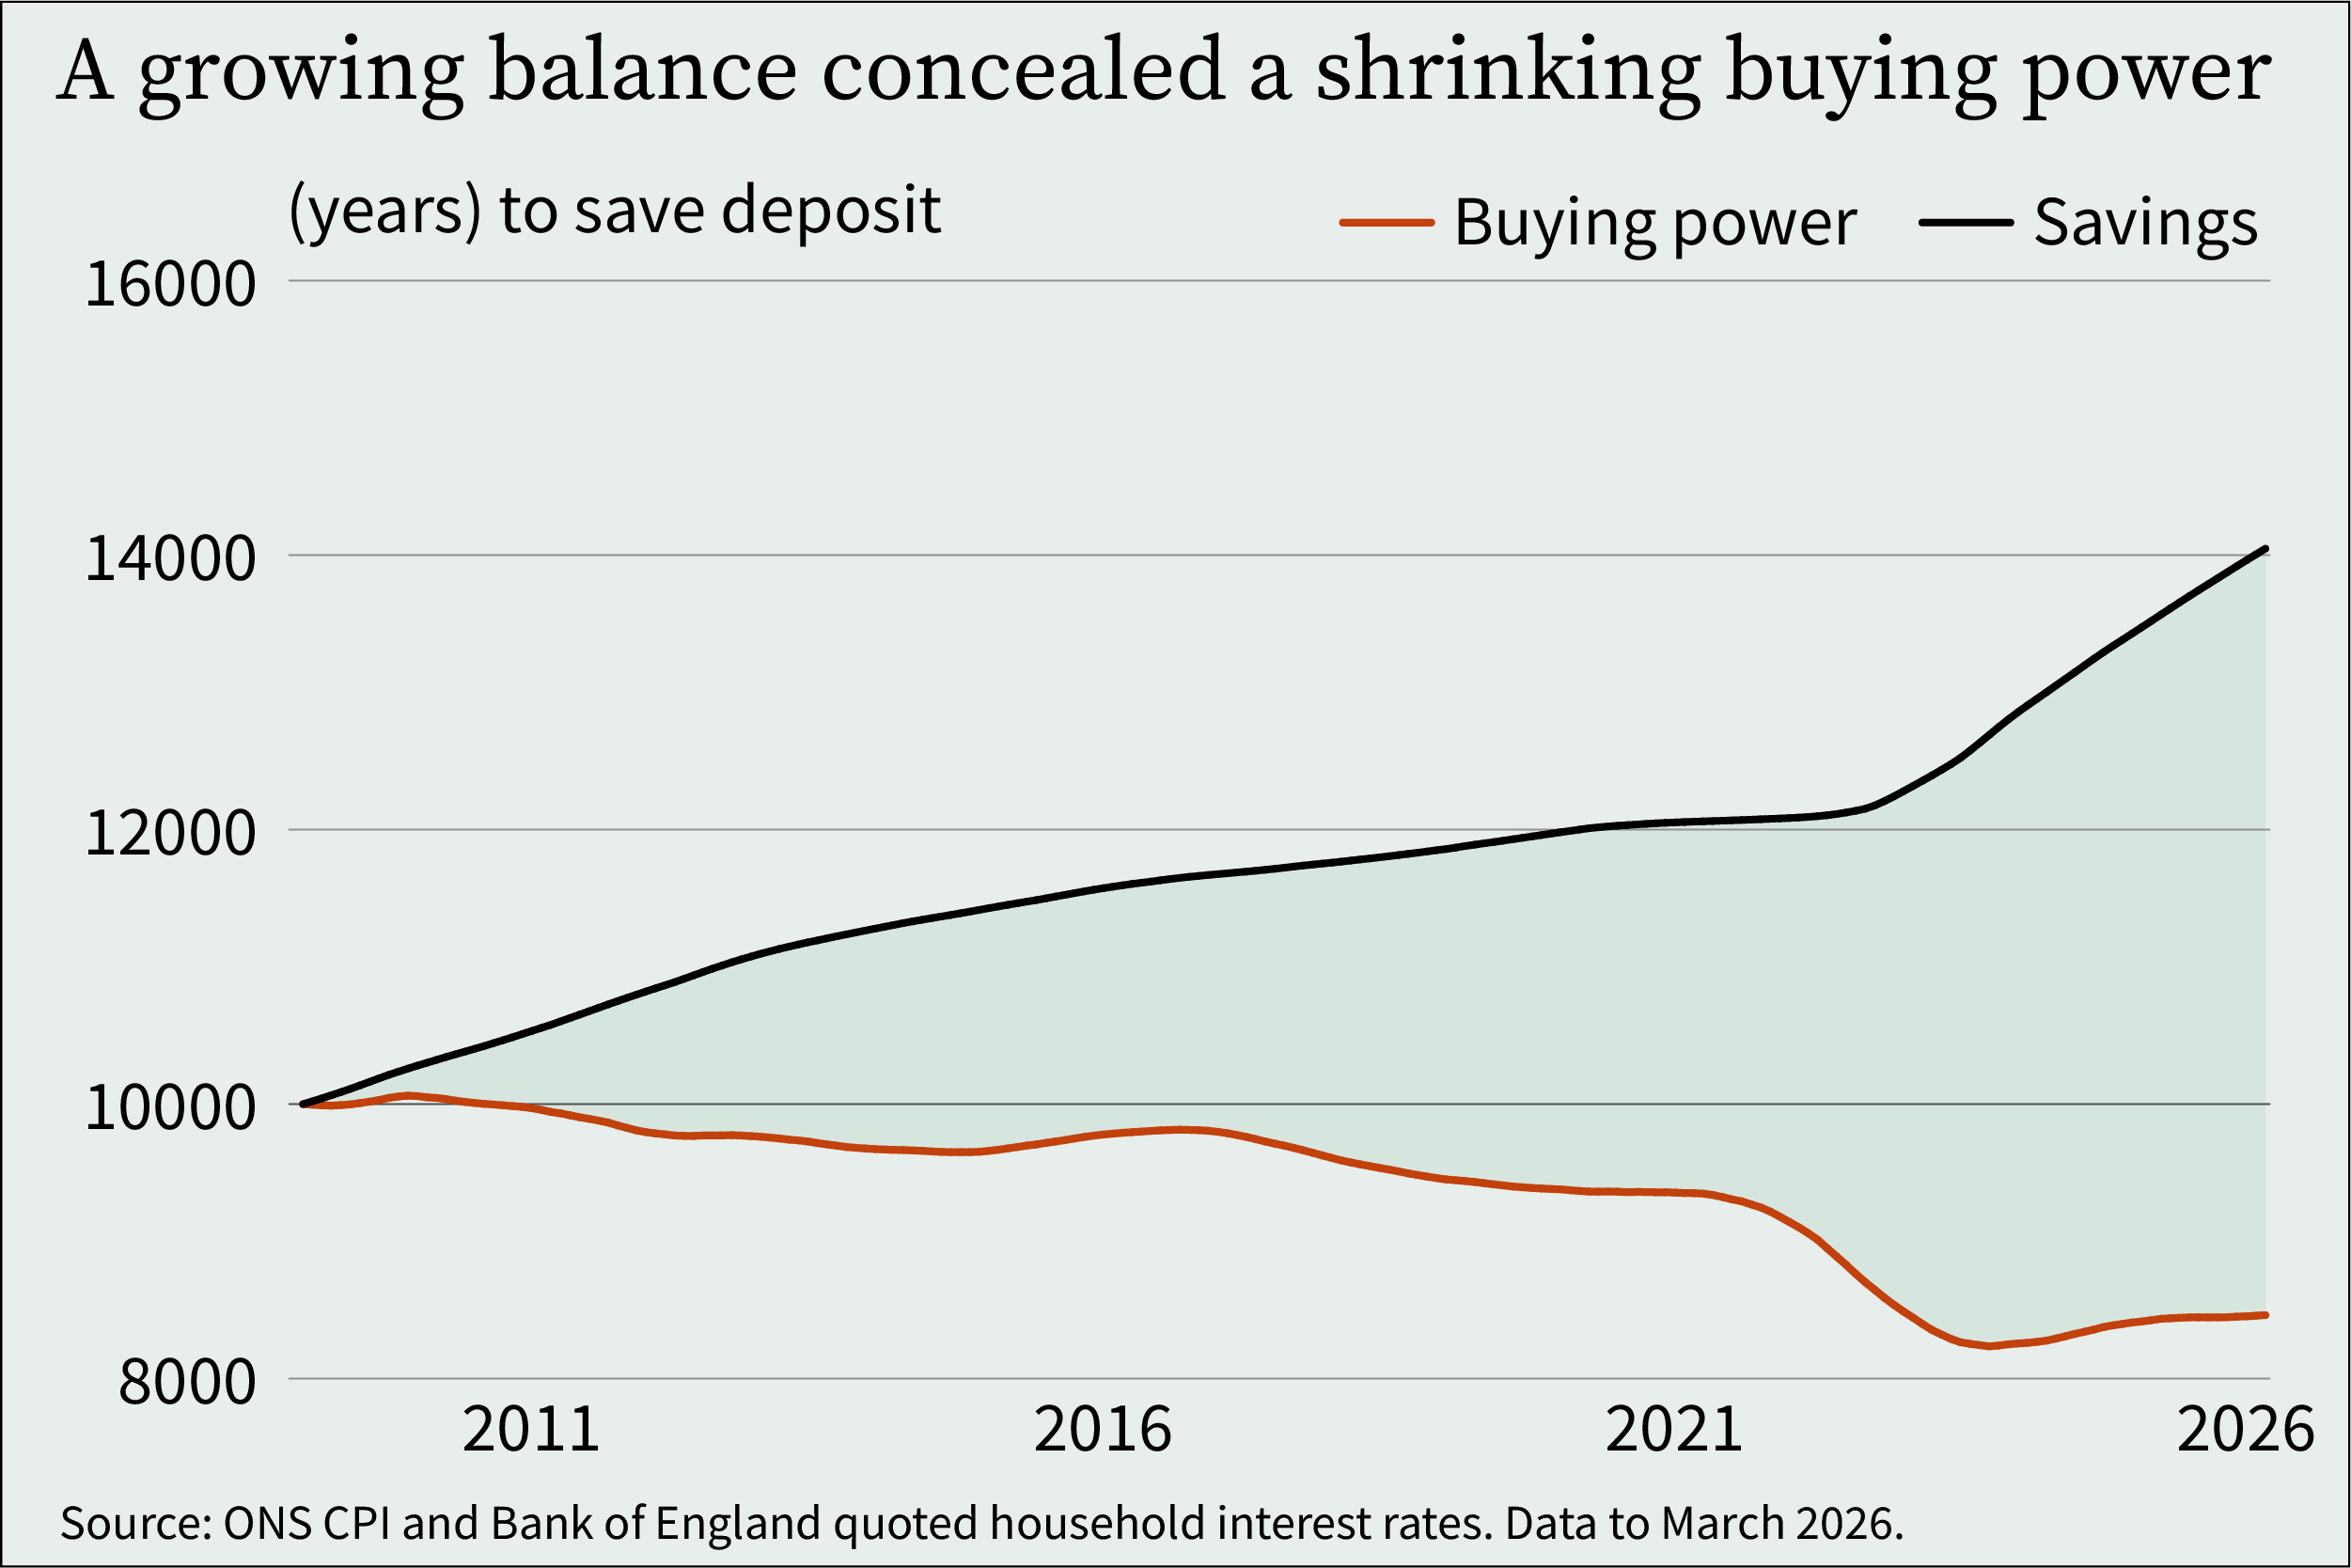
In 12 of the last 18 years, UK savers earned interest and still fell behind
Between 2009 and 2026, a one-year fixed-rate bond lost UK savers buying power in 12 of 18 years, and the data shows exactly what that cost.