In 12 of the last 18 years, UK savers earned interest and still fell behind
A one-year fixed-rate bond paid interest every year, yet in most of them the money lost buying power against inflation.
Between January 2009 and March 2026, a UK saver who held a rolling one-year fixed-rate bond watched their balance grow from £10,000 to £14,047. The number went up every year but the buying power fell.
This is not a story about bad decisions. Choosing a one-year fixed-rate bond over a current account, over cash left idle, is a considered act. It is what diligent saving looks like. For most of the past fifteen years, it was not enough.
What the balance conceals
The mechanism is simple and largely invisible. A savings account pays a nominal rate, the number on the label. Inflation erodes what that money can actually buy. The gap between the two is what a saver gains or loses in buying power terms. When inflation runs above the savings rate, that gap is negative. The balance grows; the value falls.
That gap opened in 2010 and did not close for most of the following decade. The cost compounds in a way that a rising balance makes easy to miss.
A growing balance concealed a shrinking buying power
The distance between those two lines is the cost. What the chart makes visible is not a dramatic collapse. It is the quiet, consistent removal of value from a balance that appeared, on paper, to be growing.
A decade of slow erosion, then a sharp shock
From 2010 to 2021, the one-year fixed rate averaged 1.5% against average CPI inflation of 2.1%. The shortfall in any single year was modest, rarely more than two percentage points. Over twelve consecutive years, it compounded quietly. A saver who stayed the course lost buying power in ten of those twelve years without their balance ever falling.
Then 2022 arrived. Inflation reached 11.1% in October of that year, a 41-year high. The one-year fixed rate, slow to respond, averaged just 1.6% across the year. The real return was -7.4%, the worst single year in the dataset by a significant margin.
In 12 of 18 years, UK savings lost buying power to inflation
Two years of the inflation shock undid a buying power position that the preceding decade had already weakened. The erosion of savings is not a dramatic event. It does not announce itself. It accumulates in the background of a balance that keeps rising, in a gap that most bank statements do not show.
The same £10,000, the same eighteen years
By March 2026, the real value of that original £10,000 had fallen to £8,463, a loss of £1,537 in buying power over eighteen years of consistent saving. The balance said otherwise. The statement showed growth. The buying power told a different story.
To measure the scale of that cost, a benchmark is useful. The FTSE All-Share total return index is referenced here as a ruler, not a recommendation. What the same £10,000 would have produced through a passive exposure to the index over the same eighteen years is a way of understanding the magnitude of what inflation extracted from the savings account. The comparison does not argue for one approach over another. It makes the distance visible.
The FTSE All-Share grew, inflation took its cut
The number that matters is not what the account holds. It is what that amount can buy.
This is a data analysis and visualisation, not financial advice. The FTSE All-Share total return index appears solely as a benchmark reference point, not a recommendation. The author accepts no responsibility for financial decisions made on the basis of this analysis.
Selected Work
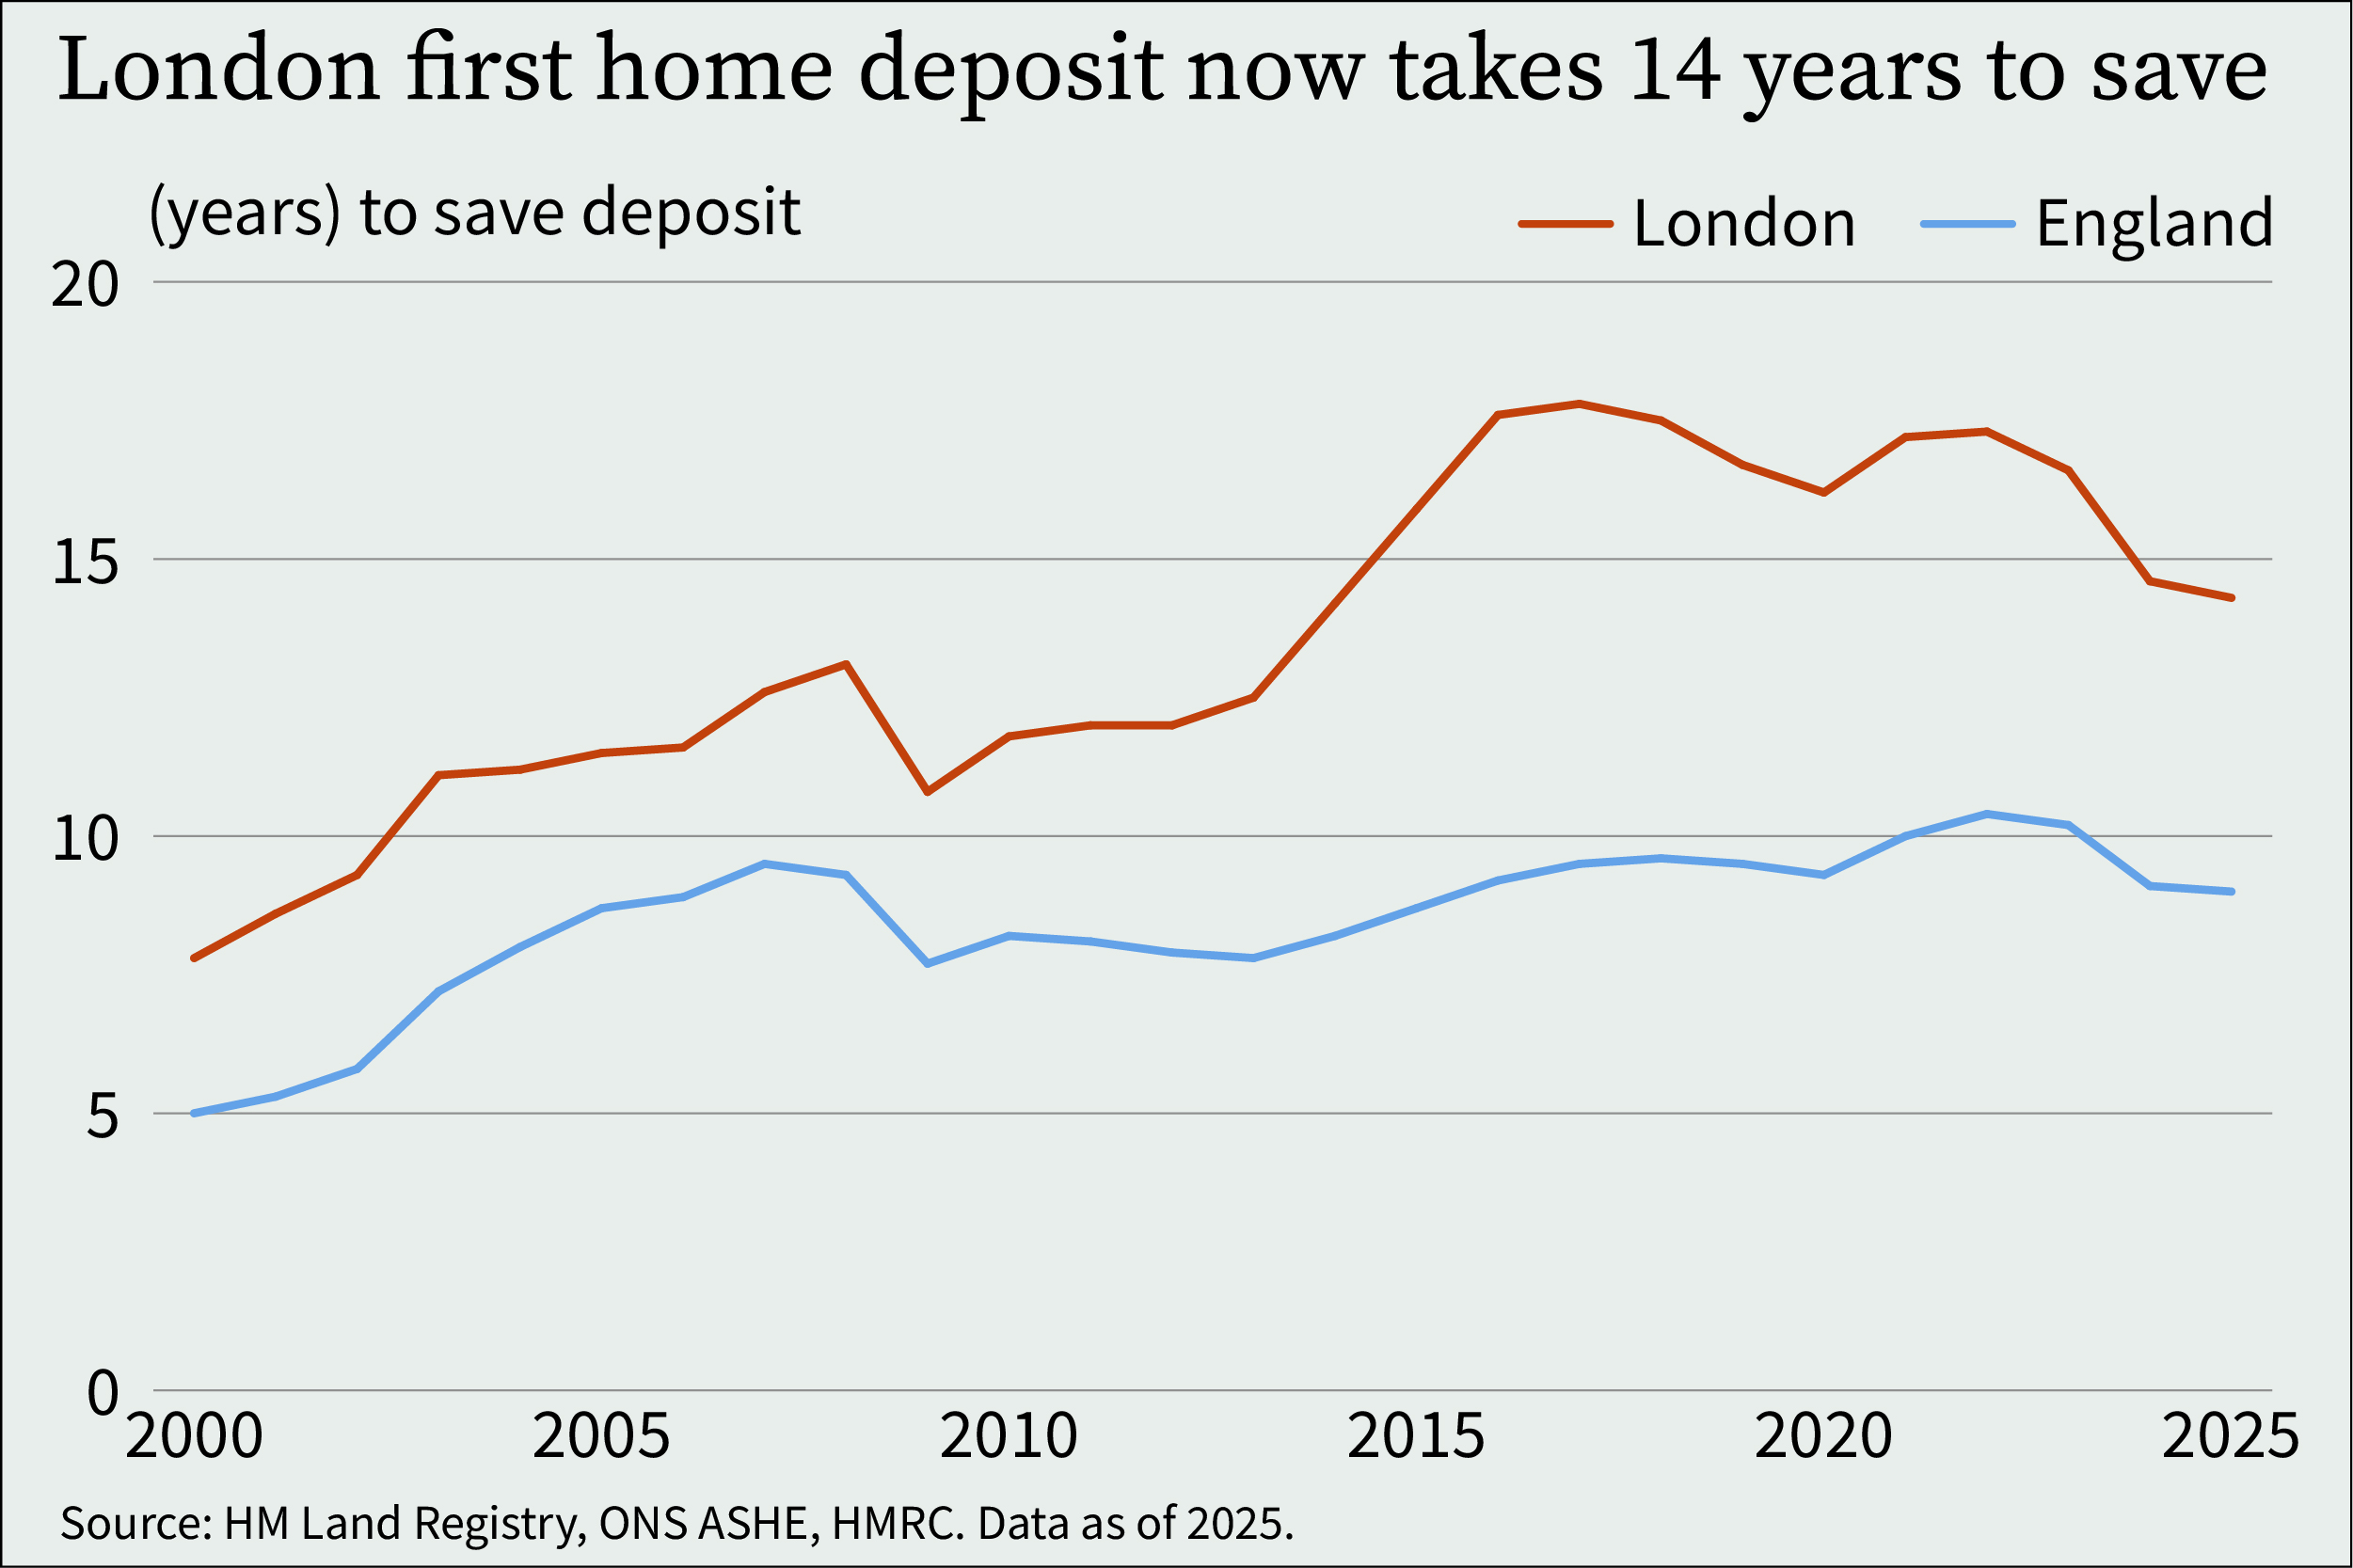
Saving a London first home deposit takes nearly twice as long as it did in 2000
At 10% of median full-time net income, saving a London first home deposit takes around fourteen years today, against around eight in 2000. The change is governed by London house prices and median earnings, and the timeline has not returned to its 2000 baseline.