Junaid Rehman
Visual storytelling is the heart of what I do. Through creative data visualisation, I make data easy to read and bring the stories to life.
Financial data is dense by nature, and its stories rarely surface at first sight. My work sits at the intersection of data and design, where finding them takes patience and a careful eye. More about me →
A journey still teaching, still surprising
The path has taken me across different financial markets, and every stop taught me something new that shaped who I am now. The turn toward data visualisation, in 2010, was when everything I had been learning found its focus. I’m grateful for the opportunities I’ve had along the way and for the joy this work brings every day.
Scroll horizontally to see the full timeline.
Selected work
These are mostly built around markets and economic indicators, with occasional pieces in adjacent fields where the same approach applies. The writing stays tight, and the graphic does the heavy lifting.
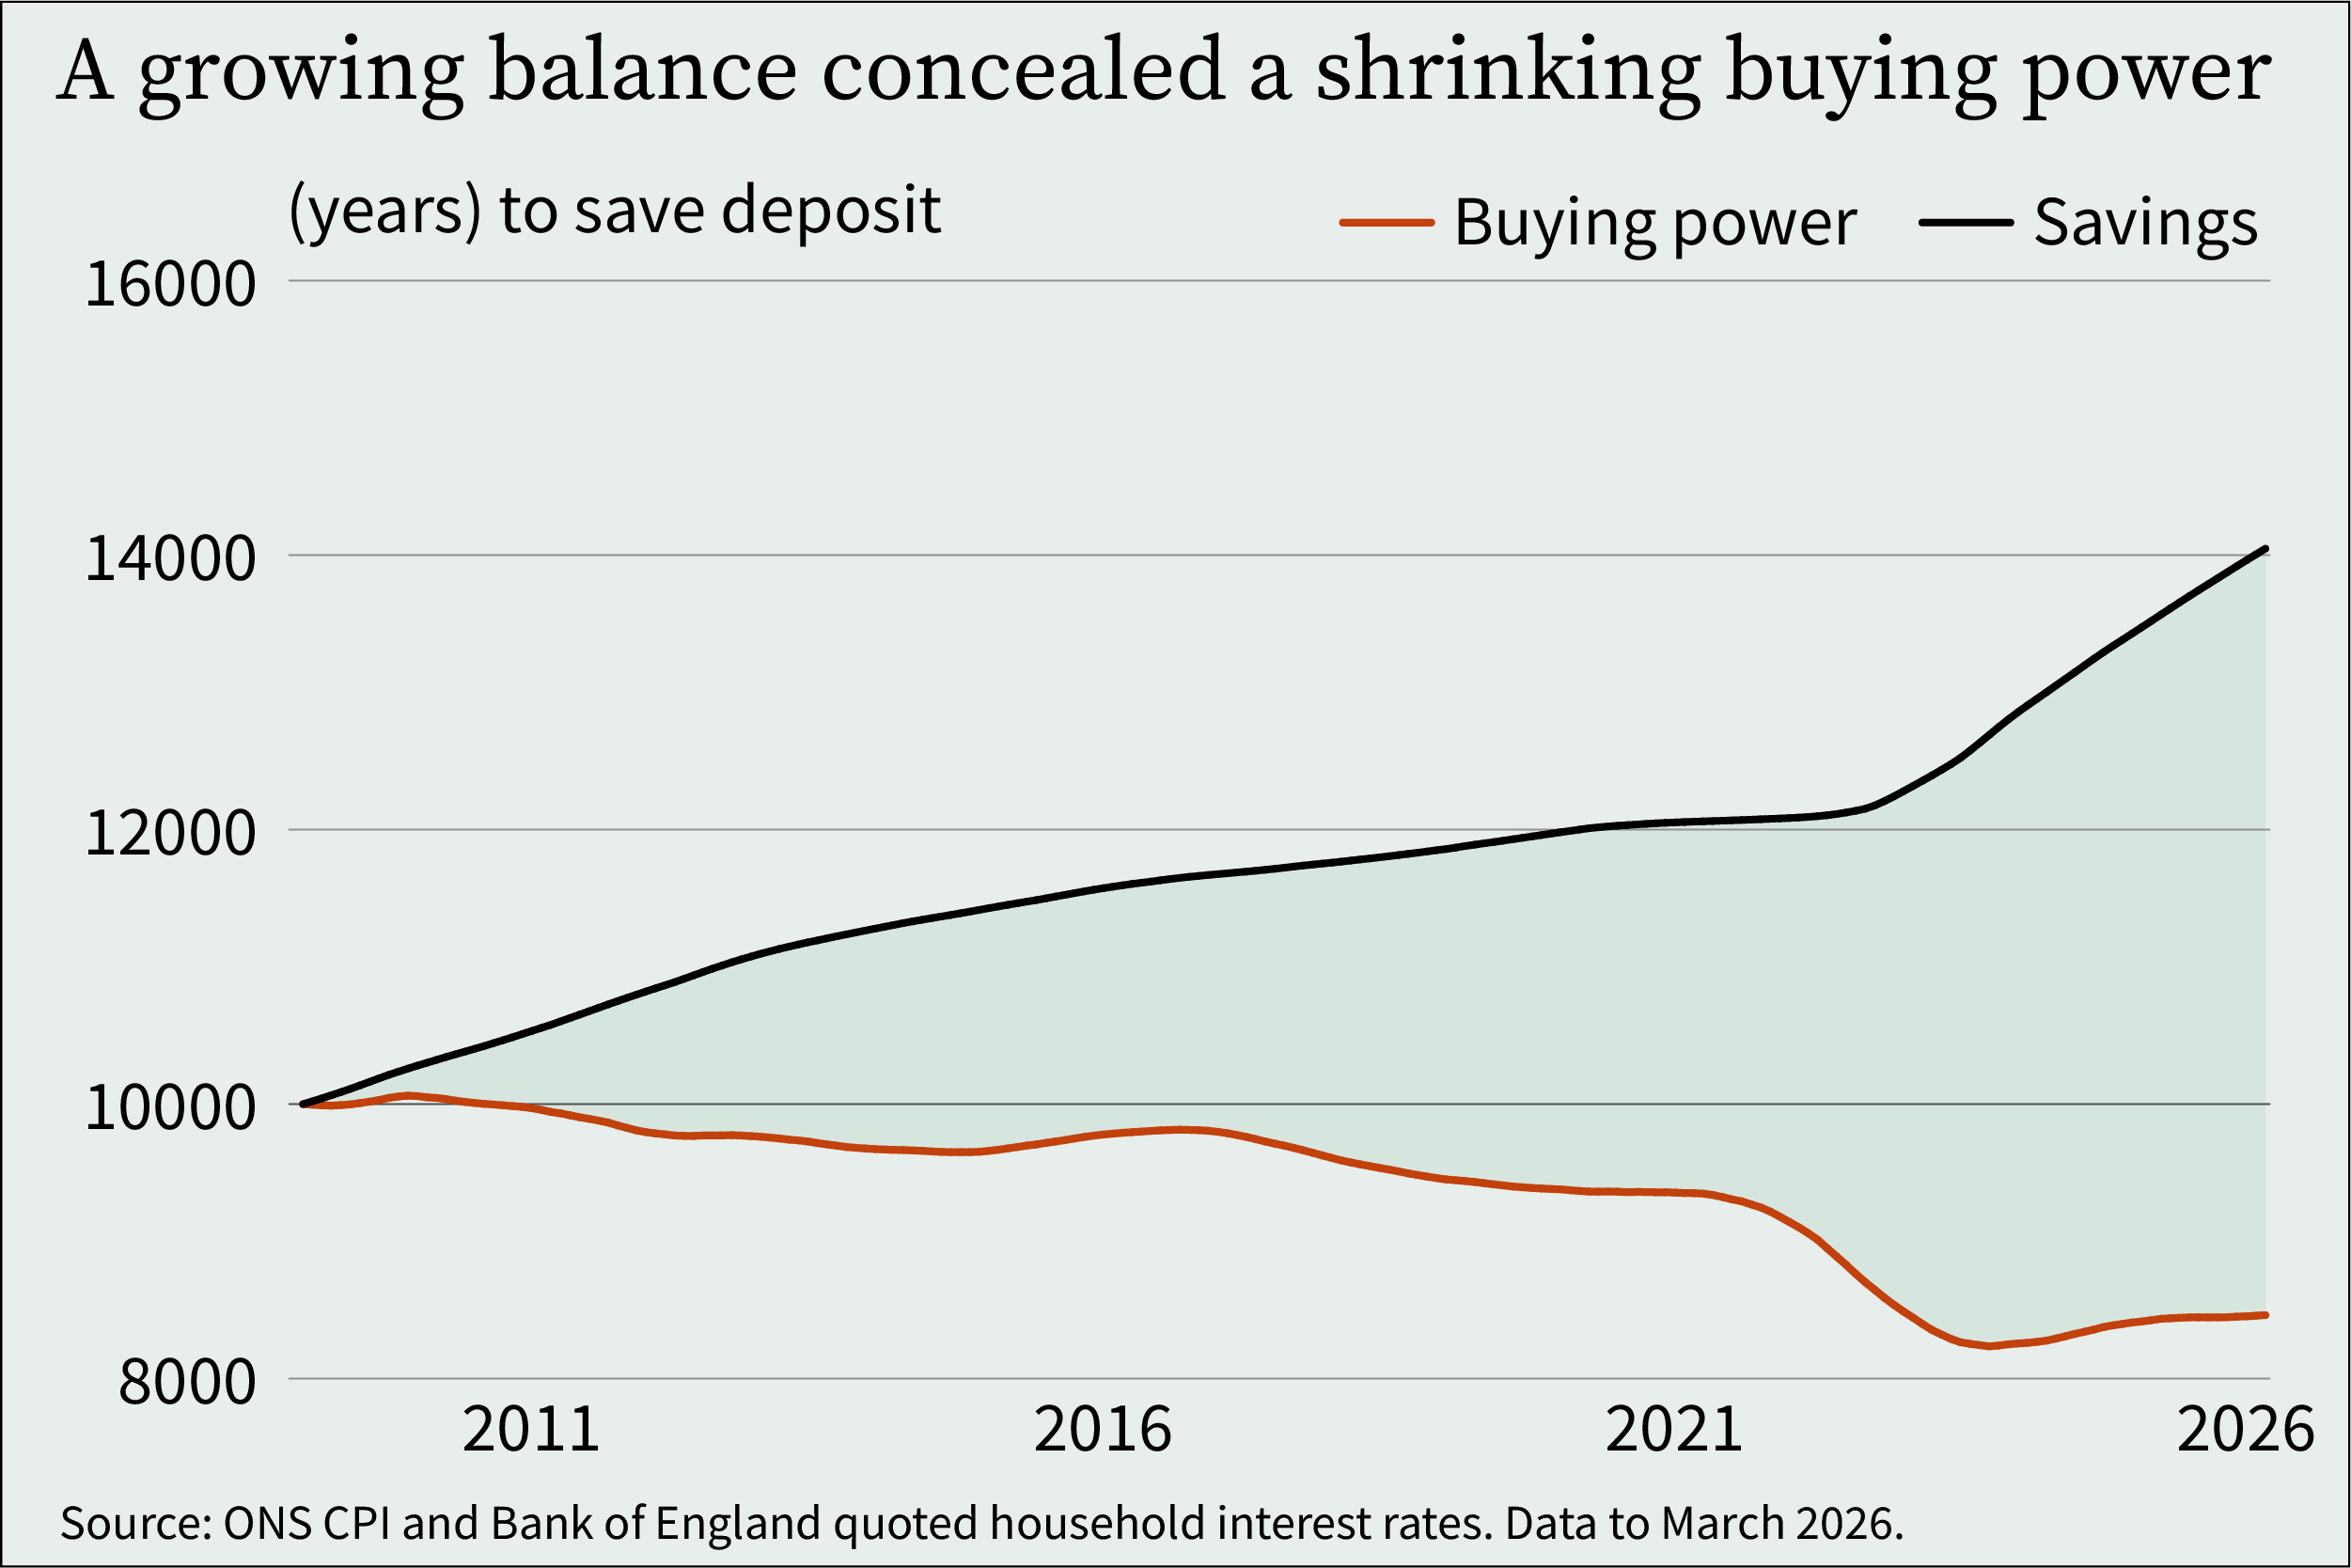
In 12 of the last 18 years, UK savers earned interest and still fell behind
Between 2009 and 2026, a one-year fixed-rate bond lost UK savers buying power in 12 of 18 years, and the data shows exactly what that cost.
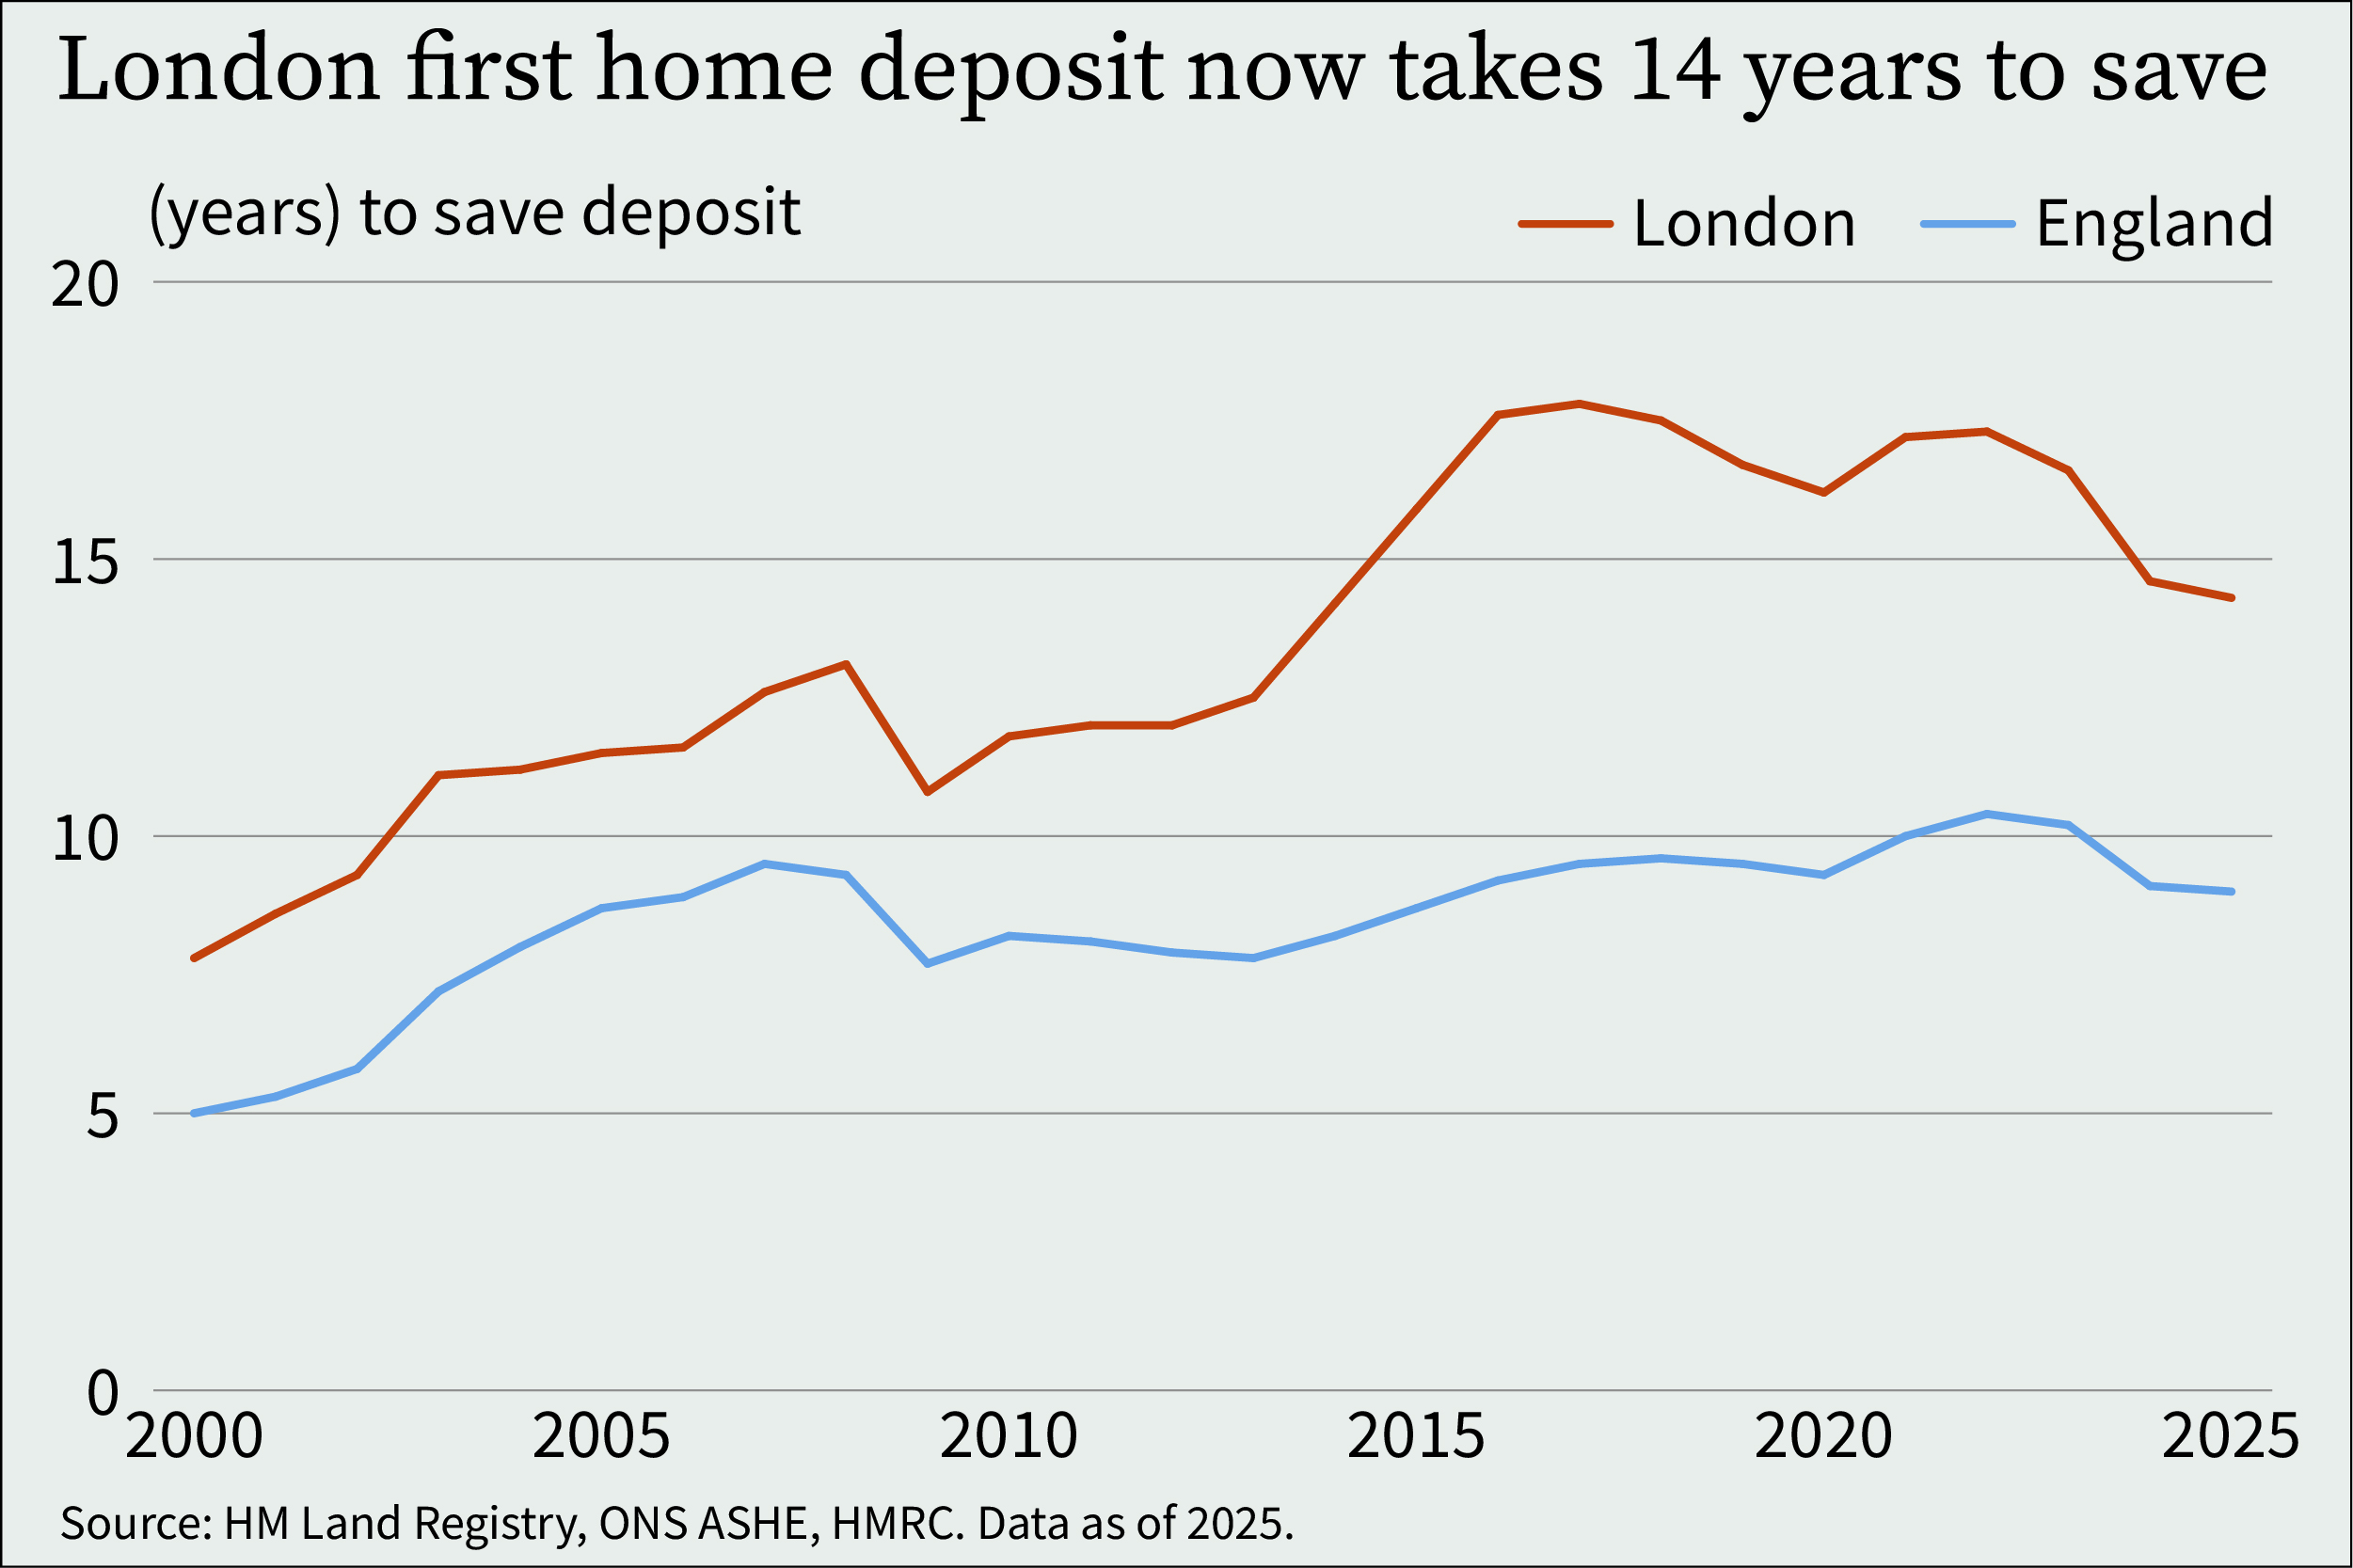
Saving a London first home deposit takes nearly twice as long as it did in 2000
At 10% of median full-time net income, saving a London first home deposit takes around fourteen years today, against around eight in 2000. The change is governed by London house prices and median earnings, and the timeline has not returned to its 2000 baseline.